Jump to: Factors affecting nutrient management | Mitigation strategy and options | Case Study
What is nutrient management?
Nutrient management is the practice of balancing soil nutrient inputs with crop nutrient requirements to improve productivity without compromising environmental quality. Plant nutrient requirements consist of micro- and macronutrients that are essential for growth and reproduction. These elements are available in the soil (e.g., nitrogen, phosphorus, and potassium) or from the air or water (nitrogen, carbon, hydrogen, oxygen).
Nitrogen (N) inputs are a major source of nitrous oxide (N2O) emissions, whereas calcium oxide or hydroxide inputs (which are known as “lime”) and urea are sources of carbon dioxide (CO2) emissions. Nutrient management can also increase plant biomass production, increasing soil organic matter and soil organic carbon (SOC), which can be released as CO2 to the atmosphere or stored in the plant or soil.
Producing ammonia fertilizer with the Haber-Bosch process can be another major source of CO2 emissions due to energy use unless energy-efficient fertilizer production methods are used (e.g., using steam methane reforming (SMR), green ammonia, or hydrogen feedstock-based production for N fertilizers).
This section focuses on N fertilizer inputs, as they produce the most emissions associated with nutrient management at the farm level.
The major sources of N inputs to agricultural soil are synthetic fertilizer, organic matter amendments, and biological N-fixation. Biological N fixation is the conversion of molecular N (N2) to forms usable by plants and animals, such as ammonia (NH3). Bacteria and cyanobacteria are responsible for this process in the soil.
When applied at the correct time and rate, in the right location, and with amendments suitable to the crop system, added nutrients help achieve optimum yields. When applied in excess of the plant’s requirements, added nutrients are susceptible
- to being released to the atmosphere as N2O via microbial transformations or NH3 via volatilization,
- leaching into groundwater, or
- running off into water bodies, a major contributor to eutrophication. Leaching and runoff also cause indirect emissions of N2O.
Contribution to emissions
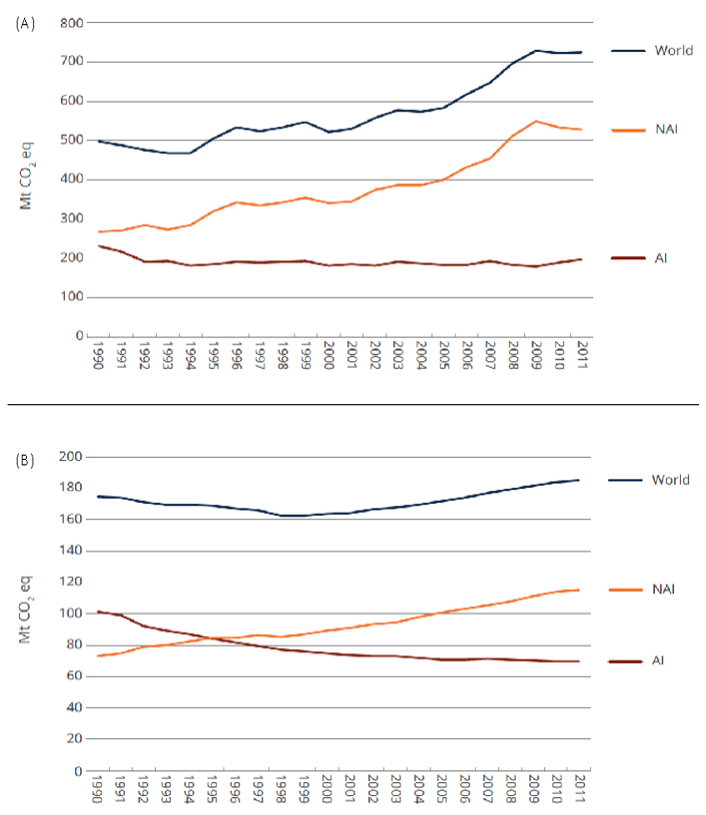
Synthetic and organic N fertilizers are significantly responsible for direct N2O emissions, a greenhouse gas (GHG), from the agricultural sector. Synthetic fertilizer application accounted for 725 Mt CO2e (Fig. 1A), or about 14% of global agricultural emissions in 2011. In the same year, manure applied to soils accounted for 185 Mt CO2e (mostly N2O) (Fig. 1B), or about 4% of global agricultural emissions.
Emissions from synthetic fertilizer and manure application to agricultural soils in non-Annex I countries represented more than 70% and 60%, respectively, of total global emissions from fertilizer applied to soil (Fig. 1).
Indirect N2O emissions associated with agriculture include:
- Atmospheric deposition (0.3 Tg N year-1 globally). See Mechanisms below.
- Nitrogen leaching and runoff (1.6 Tg N year-1 globally).
While global estimates on CO2 emissions from lime applied to agricultural fields are lacking, direct emissions from lime application are calculated according to IPCC (2006) using an emission factor for limestone of 0.396 kg CO2/kg limestone. This value does not include CO2 emissions from the fossil fuels used to crush, deliver, and spread lime on agricultural fields.
Mechanisms
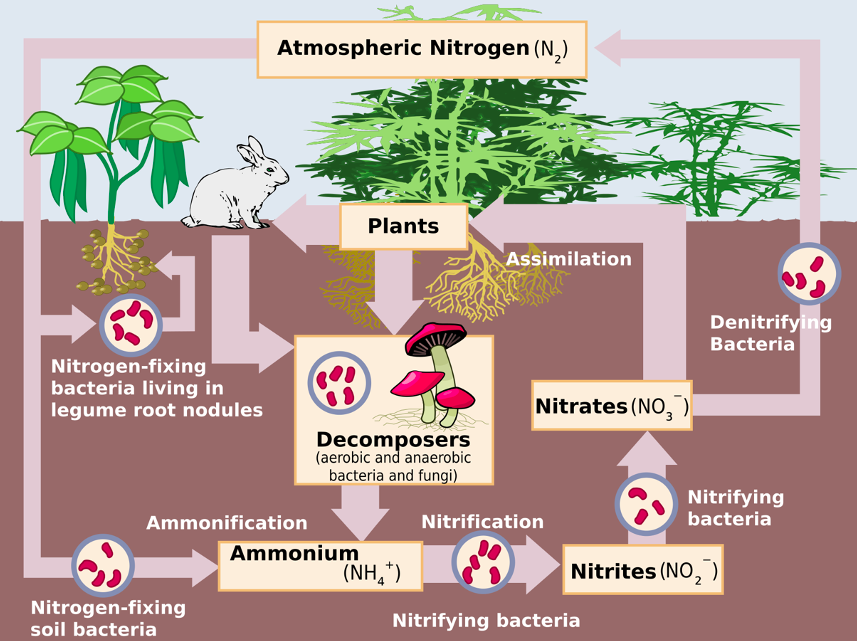
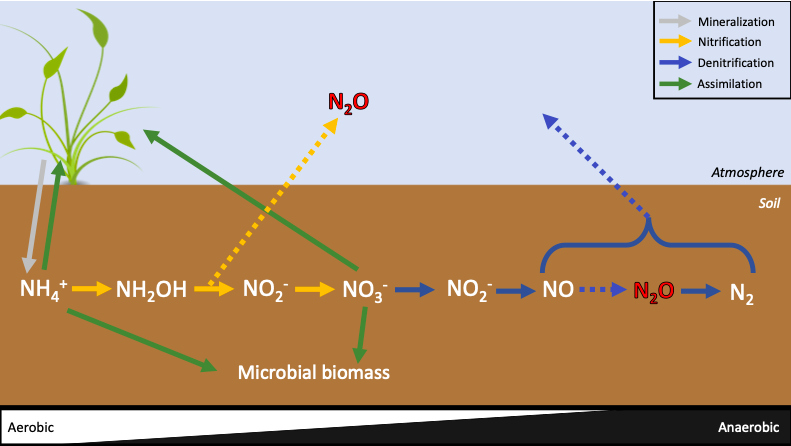
Direct emissions: Soils produce N2O by two microbial processes: nitrification and denitrification. Nitrification is the conversion of ammonium (NH4+) by microbes (nitrifiers) under aerobic conditions to nitrate (NO3–). Denitrification is the conversion of NO3– by microbes (denitrifiers) under anaerobic conditions to N2 (Fig. 2, 3), with N2 composing 78% of Earth’s atmosphere.
Denitrification is the primary mechanism for N2O emissions after N fertilization application. This is because N inputs to cropland are quickly nitrified, possibly leading to an abundance of available NO3– for denitrification by microbial transformations. As denitrification cannot occur in the presence of oxygen, which is typically present in cropland soils, denitrification is often incomplete. Read more about N2O emissions from soils here and see Figures 2 and 3 below.
Indirect emissions: N2O accounts for manure and fertilizer N that volatilizes as N oxides (NOx) or NH3 soon after application to the soil but is subsequently re-deposited on soil, providing N substrate for nitrifiers and denitrifiers. Model and measurement studies suggest that most volatilized agricultural N is redeposited on nearby soil. (Also see Manure Management)
Factors affecting
Nitrous oxide
Drivers and processes of soil N2O emissions are highly variable across temporal and spatial scales. Primary factors affecting emissions include:
- The amount of N fertilizer. Applying N in excess of a crop’s nutrient demand provides N for microbial transformations, which may be emitted directly as N2O (Fig. 2, 3) or indirectly via runoff leaching.
- 4Rs: right source, rate, timing, and location of fertilizer. See Mitigation Strategy and Options below.
- Quality of agronomy, ensuring crop productivity can support a more complete uptake of nutrients.
- Soil moisture regulates the oxygen availability to soil microbes. Optimum conditions for complete denitrification (i.e., the production of N2), which reduces N2O emissions, occur in the range of 70-80% water-filled pore space.
- Rainfall and flooding lead to changes in soil moisture and pulses of N2O emissions due to denitrification.
- Soil texture, structure, and bulk density affect soil moisture by regulating the water-holding capacity and pore size of soils.
- Soil aeration regulates the concentration of oxygen available to microbes. The lower the oxygen concentrations, the greater risk of N2O production if N is available.
- Soil temperature tends to increase microbial activity, which consumes oxygen in the process. As soil temperature rises and as soil oxygen subsequently decreases, denitrification rates increase.
- Seasonal dynamics or spatial patterns influence soil moisture, soil temperature, and soil formation.
- Microbial diversity and the constituents that possess denitrifying enzymes (e.g., nitrite reductase and nitrous oxide reductase).
- The availability of organic carbon as an energy source for denitrifying microbes. Fertilization with manure contains both N (mainly as NH4+) and organic carbon.
- Management practices that affect the above factors. For example, soil compaction from tractors decreases soil pore size and aeration, creating more anaerobic zones in the soil.
Carbon dioxide from liming
- Type of lime applied (e.g., limestone or dolomite, fine or coarse textured).
- The influence of liming on biological activity. Generally, a few years after liming, a significant increase in microbial biomass is observed (also see Biomass Carbon).
- Soil factors such as microbial activity and subsequent oxygen consumption, C:N ratio, and cation exchange capacity.
- Climate regime
Mitigation strategies and options
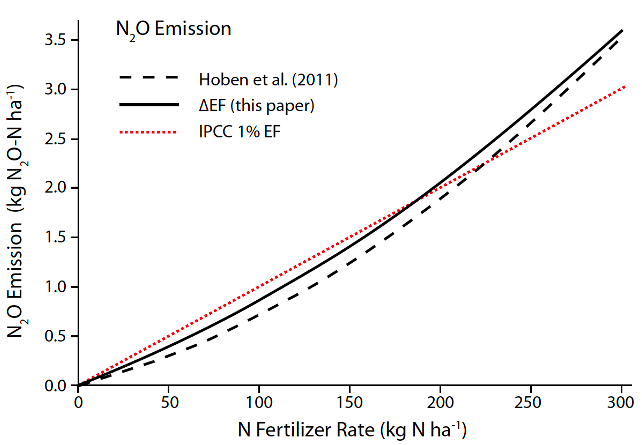
- Right rate to match the amount of fertilizer applied to the crop nutrient uptake. Perform a soil analysis to appropriately match the amount of fertilizer needed to achieve an expected yield while minimizing N2O emissions. For example, in a global meta-analysis composed of 78 studies, Scherback et al. (2014) suggest that N2O emissions tend to increase at an exponential rate when N inputs exceed the crops’ N requirement (Fig. 4).
- Right time to match nutrient application during crop nutrient demand – many times, this is close to planting. Consider the weather and seasonal conditions such as the following: (i) runoff potentially increases during the winter; (ii) saturated fields are unable to retain nutrients efficiently; (iii) applying fertilizer directly before rainfall could contribute to nutrient runoff or stimulate denitrifiers (e.g., applications at planting time and just before grain formation for some crops can ensure efficient use of N fertilizers).
- Right source matches fertilizer type to crop and soil type to determine if a combination of fertilizers should be used if nutrient inputs are for immediate or delayed crop uptake, or what nutrients are already available in the soil (e.g., suitable proportions of N, P, and K; use of dry granular v. liquid phosphorus; additives for phosphate efficiency or nitrification inhibitors).
- Right place relates to placing fertilizer in the root zone, where crops can successfully access the nutrients. For manure, this can be done by broadcasting manure onto the soil surface, followed by incorporation into the soil via tillage. However, tillage has been shown to increase CO2 emissions due to soil disturbance: tilled soils emit 21% more CO2 than untilled soils, on average. Advancements in fertilizer application machinery, such as manure injection, aim to place nutrients directly to the rooting zone with minimal soil disturbance.
Challenges to use and further development of nutrient management
- Costs and access
- Access to soil testing laboratories may be scarce or too costly in many regions.
- Access to advanced mechanization for fertilizer application, such as injection systems or equipment for precision agriculture, may be scarce in many regions.
- Additional inputs such as nitrification inhibitors represent an additional input cost to the farmer.
- The use of enhanced efficiency fertilizers, such as fertilizers with nitrification inhibitors (see below), or other management practices that slow the release of nutrients are thought to reduce N2O emissions. Still, some evidence suggests that they may only delay the time of the emissions.
- Urea deep placement can significantly enhance N uptake by the plant but may only delay emissions. Cumulative N2O emissions with and without urea deep placement in rice are the same.
- There is a need for novel amendments and more studies on their efficacy. For example, biochar has been shown to reduce N2O emissions by 38% relative to unamended soils by promoting the expression of the nitrous oxide reductase gene (responsible for the conversion of N2O to N2) in microbial populations.
- Trade-offs:
- Placing nutrients directly into the rooting zone has been shown to reduce N losses via runoff and volatilization; however, this practice risks increasing N2O emissions. Manure injection should be performed when soils are dry, and application should not be followed by rainfall for at least 72 hours.
- Increased N inputs are necessary for many places to increase soil organic carbon, yet the resulting N2O can substantially offset the emissions impacts of sequestered soil carbon.
Case study
In August 2016, the International Fertilizer Development Center (IFDC) implemented the “Accelerating Vegetable Productivity Improvement Project” (AVPI) in southwestern Bangladesh. The primary goal of AVPI was to improve the socioeconomic status of rural women and the food security status of their families by increasing their capacity to grow and market vegetable crops. Specific project interventions involved using deep fertilizer placement (right place) and balanced fertilizer application (right source and rate), among other best nutrient management practices. The project worked with 233 villages and is expected to benefit an estimated 52,000 women farmers and their families.
Based on the final results from the AVPI Project, 27,048 women farmers grew 9,693 hectares of fruit and vegetable crops under balanced fertilizer application. As a result of improved practices, vegetable and fruit yields have increased by between 2.97 and 9.82 tons ha-1, even though urea application was reduced by 833.7 tons over the project’s duration. Although GHG emission reduction was not an emphasis on the project intervention and was therefore not measured, it is highly likely that this reduction in urea application significantly reduced net emissions and emission intensity.