For more infromation, see Why LED in Agriculture, LED options, estimating emissions or policy and implementation.
- Skip to:
- Key Terms
- Significance of Agriculture
- Emissions Measurement & Accounting
- Mitigation Options
- Food Security & Diets
- Policy, Finance & Other Incentives
Key Terms
The UNFCCC defines climate change adaptation as an “adjustment in natural or human systems in response to actual or expected climatic stimuli or their effects, which moderates harm or exploits beneficial opportunities,” and climate change mitigation as “a human intervention to reduce the sources or enhance the sinks of greenhouse gases.” Thus, adaptation is responding to reduce the negative impacts of climate change, while mitigation attempts to reduce climate change.
In agriculture, drought-tolerant seeds are an example of an adaptation where climate change is expected to lead to drought. Planting trees on agricultural land to store carbon or increasing nitrogen fertilizer efficiency to reduce nitrous oxide emissions are examples of mitigation. Mitigation can be considered an extreme form of adaptation.
Sometimes adaptation and mitigation synergies occur. For example, improving soil carbon storage can enhance water holding capacity during periods of water shortage while also removing carbon from the atmosphere. Agroforestry coffee systems integrated with shade trees can buffer the coffee trees from extreme temperatures while increasing biomass carbon storage.
Trade-offs between adaptation and mitigation are also possible. For example, irrigation may support adaptation but also increase fossil fuel use. Reducing the size of a cattle herd supports mitigation but may increase a family’s vulnerability by decreasing the number of animals they can sell during emergencies.
Low-emission development strategies (LEDS) are national economic and social development plans that promote sustainable development while reducing net greenhouse gas emissions. See this overview from the UN Sustainable Development Goals Knowledge Platform.
Greenhouse gas (GHG) efficiency, or what is commonly referred to as emission intensity, shows the level of emissions relative to production level, for example, 3 tons (t) of CO2equivelants (e)/30 t of food produced. Low-emission agriculture occurs if production increases or emissions decrease relative to a future projection of business-as-usual emissions or a past level of emissions (see calculating baseline or base year).
However, emission intensity can be misleading as an indicator of mitigation to meet global climate change targets. For example, if both emissions and production increase, but production increases proportionally, emission intensity will decline. In these cases, the agricultural practice does not contribute to global mitigation targets, which require an absolute decrease in emissions. However, it does increase the GHG efficiency of agriculture and avoids additional emissions.
As many low-income countries seek to increase agricultural production to meet food needs or economic growth, using GHG efficiency (emission intensity) as an indicator of mitigation or low-emission agriculture (see low-emissions agriculture) is often favored over absolute reductions in GHG emissions. Measuring mitigation as agriculture reductions relative to future business-as-usual projections is another way of accommodating the need to increase agricultural production. It is best to provide transparency about emissions and production figures to understand the implications for absolute emissions and seek measures to reduce emissions where possible.
Low-emission agriculture is the production of crops or livestock that does not increase future emissions. Low-emission agriculture can have the goal of reducing absolute emissions or improving the greenhouse gas (GHG) efficiency of agriculture in relation to a future projection of business-as-usual (BAU) emissions (e.g., agricultural growth without mitigation measure) or the level of emissions before the LED intervention (see calculating baseline or base-year). Low-emission agriculture acknowledges that agriculture’s primary purpose is to produce food and other goods and that the environmental impact of emissions on agriculture needs to be managed (Nash et al. 2015).
Low-emission development (LED) aims to achieve improved economic, social or environmental outcomes while reducing net greenhouse gas emissions. Some refer to low-emission development as a decoupling of economic growth from greenhouse gas (GHG) emissions growth or climate-compatible development.
Mitigation is a general term for reducing or enhancing sinks of greenhouse gas emissions. Low-emission development is a specific approach to mitigation (see explanations of Low-emission development and Low-emission agriculture above).
Significance of Agriculture
No. Agricultural emissions of methane and nitrous oxide will have to decrease by ~24% by 2030 to achieve the 1.5°C target and 20% in 2030 to achieve the 2°C target. Yet, in many countries, agricultural emissions are expected to increase with the production needed to meet future food security needs. Large-scale changes in how food is produced will be needed to meet these targets. Technical innovation, especially for reducing emissions in the livestock sector, dietary shifts that minimize livestock production, reducing food loss and waste (FLW), and more carbon sequestration in trees or, where possible, the soil will help.
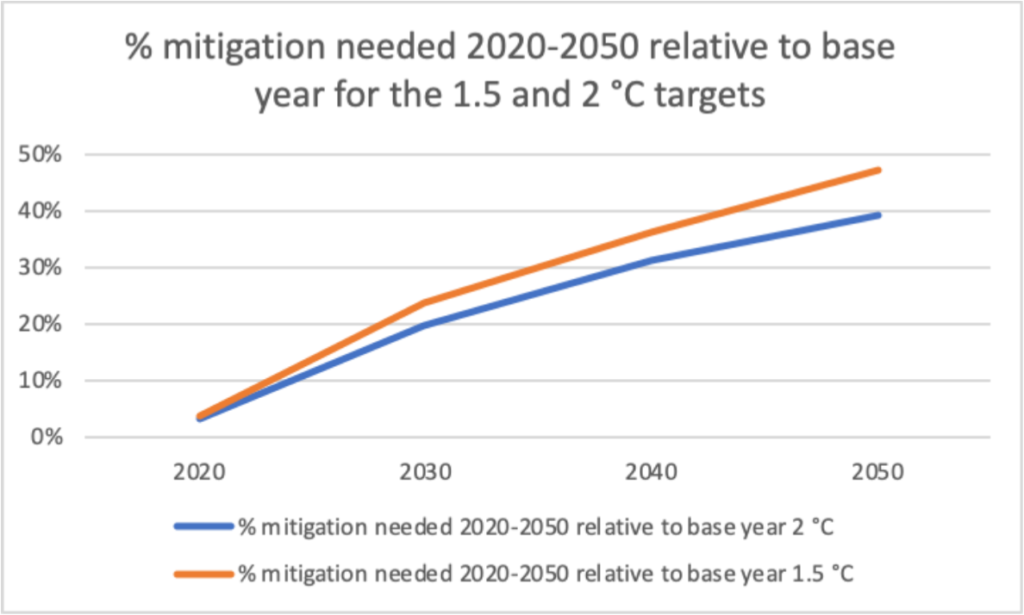
Data source: Hupperman et al. 2019
Yes, 1 GtCO2e/year by 2030 based on non-CO2 methane and nitrous oxide (Wollenberg et al. 2016). Agricultural emissions will need to be reduced by 20-24% in 2030 compared to 2020 to reach these targets based on future emission scenarios.
This science-based sectoral target is based on the global climate change mitigation target established under the Paris Agreement in 2015. In the Paris Agreement, the Parties to the UNFCCC agreed to increase international response to climate change by limiting global temperature rise below 2 ˚Celsius by 2100 and to pursue efforts to limit the increase to 1.5 ˚C.
Agriculture contributes directly to ~10-12% of global anthropogenic emissions and indirectly to an additional ~6-7% through land-use change (Smith et al. 2014) – comprising 80-86% of total food system emissions (Vermeulen et al. 2012).
The top ten recent GHG emitters (2008-2017) include three developed (Annex 1) countries and seven developing (non-Annex 1) countries (the European Union (EU) is counted as one entity). China is considered a developing country and has been the world's largest GHG emitter, followed by India and Brazil. Developing countries emit more than developed countries, contributing to about 80% of global agricultural emissions, even though the rates of emissions per hectare or animal are usually lower than in developed countries (FAOSTAT 2020).
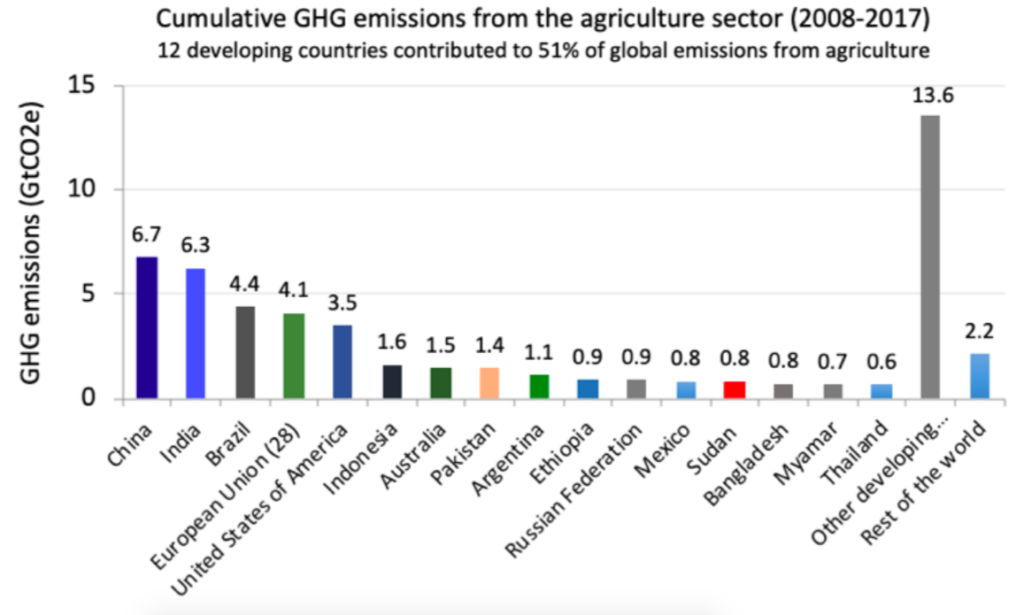
Source: FAOSTAT 2020
Agriculture contributes directly to ~10-12% of global anthropogenic emissions and indirectly to an additional ~6-7% through land-use change (Smith et al. 2014) – comprising 80-86% of total food system emissions (Vermeulen et al. 2012). Food production must increase by 60% by 2050 to meet global food demands (Alexandratos and Bruinsma 2012), which would increase agriculture's share of global emissions. Most of the additional emissions are expected to occur in developing countries (Smith et al. 2007).
Therefore, improving agriculture productivity and resilience while mitigating greenhouse gas (GHG) emissions is a necessary development pathway considering increasing food demand and climate change. However, achieving the required systemic change for large-scale impacts remains a challenge, especially for smallholder farmers in developing countries. Countries seeking improved food security will likely increase their agricultural emissions relative to current levels.
For example, to meet 2050 maize demand in Sub-Saharan Africa, nitrogen fertilizer use is expected to increase by 15 times relative to 2015 levels (van Ittersum et al. 2019; Jayne et al. 2019). The contribution to the global carbon balance will be significant if current trends continue.
Emissions Measurement & Accounting
Yes, they can be, especially to raise awareness and plan mitigation action.
Pros: GHG calculators provide an accessible approach for non-specialists to estimate GHG impacts from agriculture because they are inexpensive, rapid, and a less knowledge-intensive option than other GHG quantification alternatives (i.e., in-situ measurement campaigns or process-based models).
Cons: Although calculators are based on IPCC guidelines, this does not guarantee a uniform approach or the accuracy of the results. Richards et al. (2016) showed that estimates based on GHG calculators in tropical countries were within the 95% confidence interval of the measured value in only 19% of the cases tested.
Therefore, since the level of uncertainty remains very high, calculators are mainly recommended to raise awareness and plan mitigation action. This could become problematic if calculators are used to select projects for financing or imposing trade barriers in global markets (Colomb et al., 2013).
It depends. Both project and national GHG accounting systems usually follow IPCC guidance. However, project accounting is often flexible in how agriculture is defined (e.g., it may include soil carbon or energy and fossil fuel use) or in the choice of methods (e.g., how to set a baseline).
Yes, it absolutely can. Suppose a farm emits 1.0 tCO2e to produce one ton of a given cereal but loses 40% in post-harvesting processes. In that case, the actual emissions intensity is almost 70% higher or 1.4 tCO2e per ton produced. Therefore, this farm is less efficient than a farm emitting up to 1.3 tC22e to produce the same quantity of cereal under no post-harvest loss.
Greenhouse gas (GHG) measurement methods differ based on the system or source under consideration. Standard methods for measuring GHG emissions from soils tend to rely on either chamber-based methods or micrometeorological approaches. The former is the most widely used technique due to its low cost and applicability at remote sites.
Many different measurement methods for quantifying CH4 emissions from ruminant livestock exist, although all have limitations. However, respiration chambers are considered the most accurate method of assessing enteric CH4 production in individual animals.
Agriculture, forestry and other land-use (AFOLU) covers the land-use sector, including agriculture. It includes carbon sequestration in biomass and soil, CO2 emissions from biomass and soil carbon, the agricultural non-CO2 gases of methane and nitrous oxide and land-use change. Land use, land-use change and forestry sector (LULUCF) covers the land-use sector, without agricultural non-CO2 gases.
According to IPCC guidance, agricultural emissions are defined as methane and nitrous oxide emissions only. Carbon stocks and removals are accounted for under the LULUCF. The 1996 IPCC guidelines for accounting separate agriculture and LULUCF. The 2006 IPCC guidelines (required to be used after 2015 by Annex 1 countries) linked agriculture and LULUCF in one category known as AFOLU. See the table below and this GHG Institute guide for the differences between LULUCF and AFOLU accounting. LULUCF is also referred to as Forestry and other land use (FOLU).
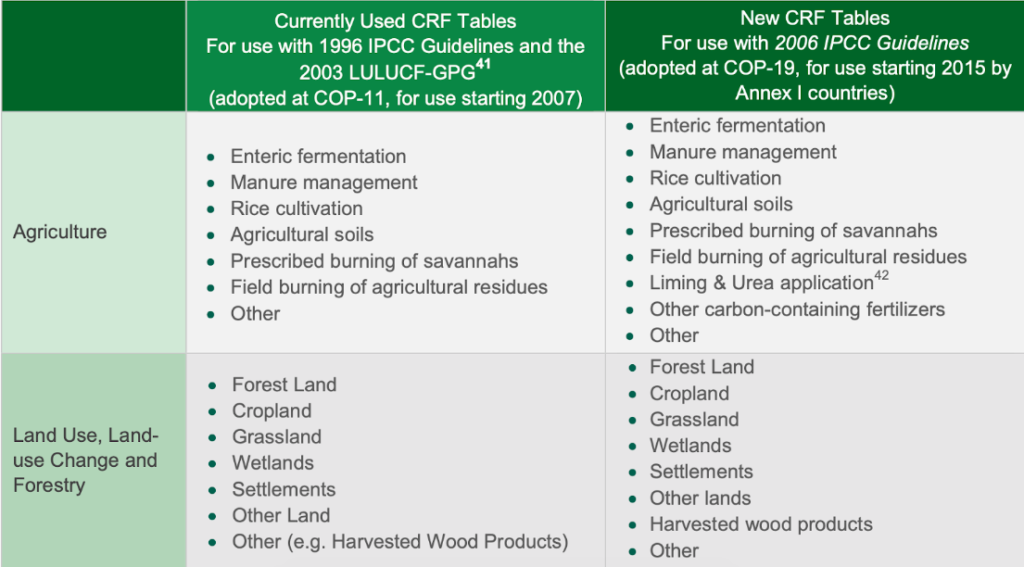
Common reporting formats (CRF) for agriculture, land use, land-use change and forestry used in national inventory reports. (Source: GHG Insitute, Understanding Land-Use in the UNFCCC, Table 4)
Yes, by focusing on a performance standard point of reference for measurement. As a result, a benchmark can represent a fixed level of emissions that can serve as a reference for comparison. Benchmarks are frequently based on – but not restricted to – averages and percentiles of emissions by production efficiency (e.g., emission per product or hectare) and use of farming inputs (e.g., emissions versus the yield of nitrogen fertilizer optimization rates). This allows emissions by alternative farming systems to be compared and identifies the level of emissions associated with different parts of the value chain (i.e., processing, retailing and consumption, and food waste).
Poore & Nemecek (2018) showed that, for beef originating from beef herds, the highest-impact 25% of producers represent 56% of the beef herd’s GHG emissions. In contrast, distribution and retail losses contribute 12-15% of emissions, and the sum of emissions from packaging, transport, and retail contributes just 1-9%. Thus, improving beef production efficiency and reducing food losses are clear priorities.
No. IPCC guidance treats energy separately from agriculture and land-use. Yet, depending on the purpose, some accounting tools or systems may elect to account for energy use on farms or in the supply chain.
A suite of tools and methods is available for estimating emissions from agriculture, which vary in terms of precision and complexity (Olander et al. 2014). These methods can be categorized into direct field measurements (e.g., SAMPLES), GHG calculators (e.g., EX-ACT and Cool Farm Tool), statistical models (Wilkes et al., 2020) and process-based simulators (e.g., DNDC and DayCent). Also, there are tools and methods for estimating emissions from different agriculture value chains and products (Caffrey & Veal, 2013) and emissions from food loss and waste (ACGE-WUR).
Visit the Tools & Calculators pageCalculating GHG emissions, especially in developing countries, is challenging due to a lack of data and technical expertise. The biggest need is access to activity data, but also in having more precise emission factors. Countries may use a variety of methods to fill data gaps and develop country-specific emission factors:
- Performe questionnaire surveys and expert judgment interviews are useful data collection methods when there is no usable data.
- Use methods for filling time series gaps can also be used, such as interpolation, extrapolation, and surrogate data.
- Build linkages among statistical systems, including global databases (i.e., FAO-Stat), agriculture censuses (i.e., FAO World Programme on Agricultural Censuses), remote sensing, crowdsourcing and involving supply chains.
- Get familiar with variables involved to develop Tier 2 emission factors (IPCC, 2019) for prioritizing and planning data collection.
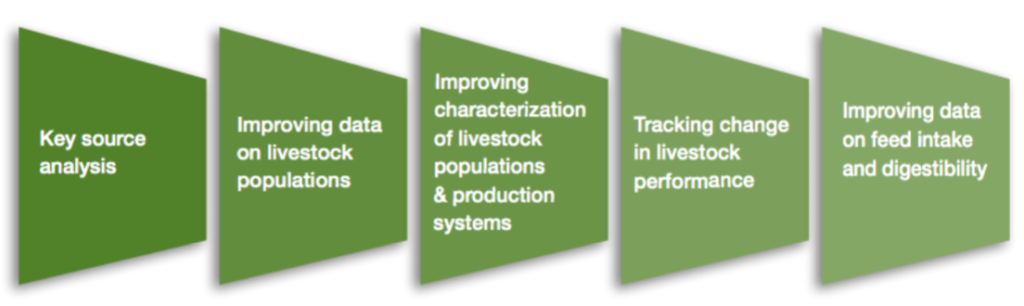
Stylized strategy for improving the accuracy of estimated livestock GHG emissions for a given year in a national GHG inventory.
The major sectors in agriculture that contribute to emissions and their mitigation are livestock, paddy rice, other crops, agroforestry and land-use change. The largest proportion of agricultural emissions is from land-use change linked to deforestation or conversion of peatlands caused by agricultural expansion. Livestock is the largest source of direct emissions from agricultural production.
According to the 2006 IPCC Guidelines, greenhouse gas emissions associated with agriculture include methane (CH4) and nitrous oxide (N2O) (not CO2) emissions from the following sources:
- Enteric fermentation from livestock
- Manure management
- Rice cultivation
- Agricultural soils
- Prescribed burning of savannahs
- Field burning of agricultural residues
- Liming and Urea application
- Other carbon-containing fertilizers
See IPCC (2007) Chapter 8 on mitigation potentials for these subsectors and sources.
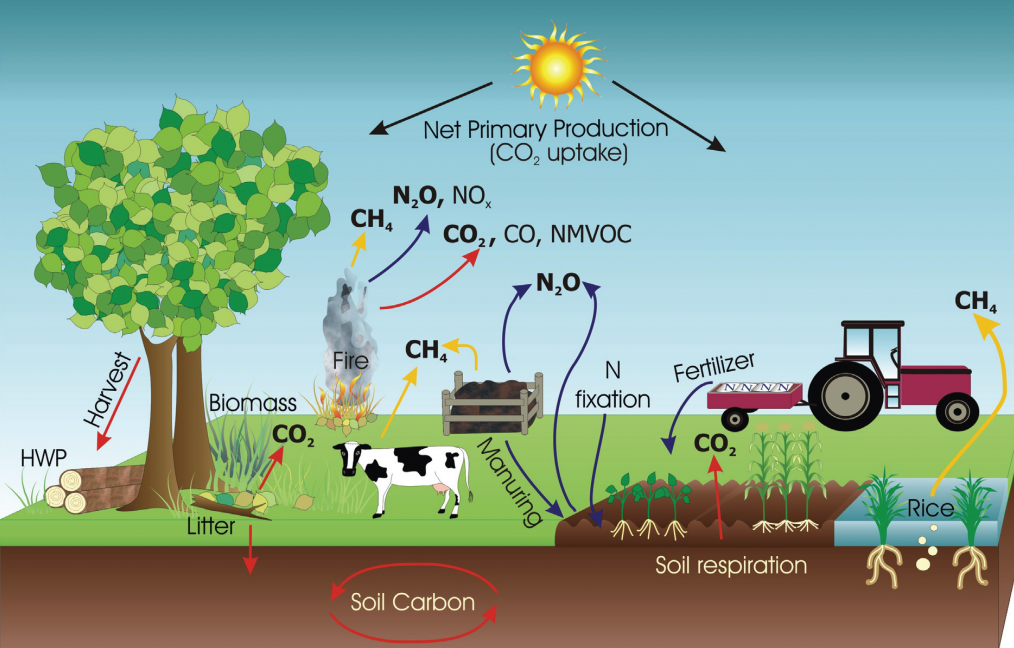
This figure shows the moving parts and interconnectedness of the on-farm carbon cycle. Sources vary depending on farm type and management system. Image credit: IPCC
The scope of agricultural emissions is usually limited to the farm, but sometimes, accounting includes emissions in the supply chain or landscape. For example, accounting can include the use of farm inputs such as fertilizer or animal feed. In other cases, accounting includes direct agricultural emissions and indirect emissions from the conversion of land for agriculture.
IPCC guidance treats agricultural emissions as only nitrous oxide and methane emissions from crop and livestock production at the farm level. Defining the scope of agricultural emissions is important to ensure transparency. It should consider the GHGs included, the extent of the input and product supply chain or landscape included, and the sectors included (e.g., energy v. AFOLU).
According to IPCC guidance, agricultural emissions are defined as methane and nitrous oxide emissions only. Carbon stocks and removals are accounted for under the land use, land-use change and forestry sector (LULUCF) rather than in agriculture. Therefore, many agricultural statistics do not account for carbon stocks or removals from the soil or biomass on agricultural land.
Agricultural soil carbon is accounted for under IPCC guidance. However, it is done so under forestry and other land use (FOLU), not agriculture, within AFOLU (previously LULUCF). Specifically, agricultural soil carbon is accounted for within “cropland remaining cropland” and “grasslands remaining grasslands” to account for the possibility of changes in land-use and agricultural practices.
CO2 emissions from agriculture are considered to be neutral as crops fix atmospheric CO2 during photosynthesis. Thus, only non-CO2 sources are reported as anthropogenic GHG emissions in the agricultural sector.
Mitigation Options
Most food emissions are generated at the farm or field level and not at later stages in the supply chain. The total emissions associated with the global food system are ~13.7 Gt CO2e or 26% of anthropogenic GHG emissions, including deforestation due to agriculture. Of these emissions, on-farm emissions represent 61% of the food system’s GHG emissions (81% including deforestation) (Poore & Nemecek 2018).
According to the FAO, one-third of all food produced for human consumption never reaches the consumer’s table. Emissions of GHG related to global FLW accounts for an estimated 3.3 gigatons of CO2e emissions per year (UN FAO), or about 6% of total anthropogenic GHG emissions. This means that food wastage emissions to global warming are almost equivalent to global road transport emissions.
If FLW were its own country, it would be the third-largest emitting country after the US and China. Reducing FLW (SDG 12.3.1) is expected to decrease the food production needed, thereby avoiding associated emissions from crop and livestock production. However, in some cases, production will not necessarily decline, and FLW will only lead to decreases in emission intensity.
In agriculture, technical mitigation options relate to cropland and livestock management, management of organic soils (peatlands and wetlands), land-use change, and improving energy efficiency. Key mitigation options include:
- Reducing or avoiding N2O emissions from the application of nitrogen fertilizers to soils and drainage of organic soils
- Reducing CH4 emissions from water management in paddy rice
- Reducing CH4 and N2O emissions from the storage, processing, and application of manure
- Reducing or avoiding CO2 emissions from land use and soils by sequestering carbon
- Reducing enteric CH4 emissions from livestock management
- Reducing CO2 emissions from machinery and energy use on farms
The figure below (adapted from Paustian et al. 2016) provides examples of the global mitigation potentials resulting from adopting sustainable agricultural management practices. Multiple practices are aggregated for cropland management (e.g., reduced tillage, nutrient management, improved crop rotations) and grazing land management (e.g., improved grazing management, species introduction, nutrient and fire management). ‘Set-aside’ land refers to arable land removed from crop production and converted for perennial systems, often grasslands, and is not actively managed for agricultural production. See also Sequestering Carbon in Soil and FAO/GSP, 2017 Soil Organic Carbon: the Hidden Potential and the WOCAT database.
Read more about agricultural emission mitigation strategies and their feasibility
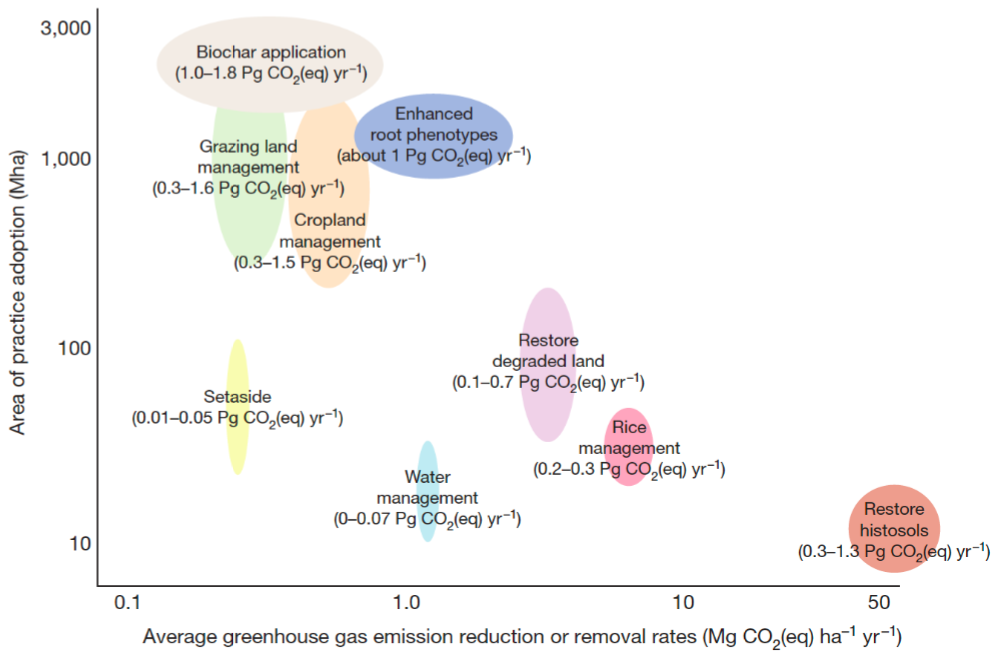
Source: adapted from Paustian et al. 2016
Pros:
- Sequestering carbon in soils acts as a buffer against anthropogenic climate change by reducing the concentration of CO2 in the atmosphere through biological processes.
- Soil organic carbon (SOC) is the most critical component of soil fertility. Increasing SOC stocks in agricultural systems is crucial for crop production and global food security.
- SOC increases ecosystem resilience and climate change adaptation by improving soil health and function, including in nutrient cycling and storage, water infiltration, soil moisture retention, and erosion mitigation.
- Soil’s capacity to sequester and retain carbon is finite as it reaches a steady-state or equilibrium. The rate of carbon loss or gain depends on several climatic, land-use, and management variables.
- Permanence and reversibility risk.
- SOC stocks are difficult, time-consuming, and expensive to measure. Stock changes within 10% are difficult to detect due to sampling errors, small-scale variability, and uncertainties with measures and analysis (Sparling et al. 2006).
- It is difficult to identify if SOC sequestration results from natural factors, improved management activities or land-use. This has important implications for carbon markets and credits.
- Increases are often not detectable until at least 3-5 years after an intervention.
- The management practice must be maintained to retain carbon in the soil.
One of the challenges to addressing SOC sequestration feasibility is distinguishing between what is technically feasible and what might be achieved given economic, social, and policy constraints.
Further Reading- Paustian K, et al. 2016. Climate-smart soils. Nature
- Bossio DA, et al, 2020. The role of soil carbon in natural climate solutions. Nature Sustainability
- Rumpel C, et al. 2019. The 4p1000 initiative: Opportunities, limitations and challenges for implementing soil organic carbon sequestration as a sustainable development strategy. Ambio
- Demenois J, et al. 2020. Barriers and Strategies to Boost Soil Carbon Sequestration in Agriculture. Frontiers in Sustainable Food Systems
- Amundsen R, Biardeau L. 2018. Opinion: Soil carbon sequestration is an elusive climate mitigation tool. PNAS
The technical mitigation potential indicates the maximum biophysical mitigation achieved under the implementation of an available option. The economic mitigation potential indicates the extent of mitigation possible for a given cost of a ton of CO2e (such as USD 20, 50 and 100 dollars). The feasible mitigation potential indicates the extent of the technical mitigation expected under constraints and opportunities for farmer adoption of the new practices.
For policy purposes, it is also important to convert mitigation potentials into economic potential, which provides a perspective on whether emission reductions are cost-effective relative to mitigation measures and potentials offered by other sectors of the economy.
The role of soil carbon has been increasingly recognized as a key element of avoiding global warming above 2˚C. Through soil organic matter protection and restoration, soils could deliver 23.8 GtCO2e y-1 in emission reduction by 2030 (Bossio et al., 2020).
Food Security & Diets
Yes, but the answer depends on the context of agriculture production. There are potential synergies or trade-offs in the changes in agricultural production needed to meet global food security. The trade-offs and synergies vary by agroecological condition, historical land-use, and current production systems in a location.
The potential for synergies is particularly high for adopting improved crop varieties, changing crop rotations to incorporate food-producing cover crops and legumes, adopting precision fertilizer management, and expansion of agroforestry and soil and water conservation techniques that do not take significant amounts of land out of food production.
Trade-offs are more likely when mitigation options take land out of production, either temporarily or permanently. For instance, restoration of degraded lands often requires that land not be used for production, at least in the short-term, whereas avoiding draining or restoring wetlands would directly take land out of production permanently. Trade-offs may also be important for certain stocking rates and rotational grazing practices.
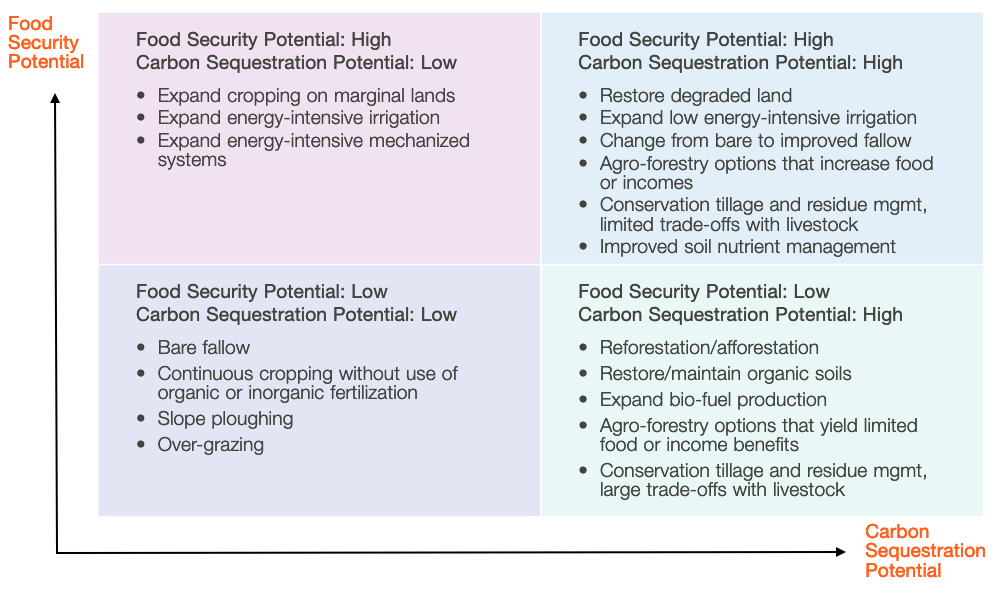
Source: Examples of Potential Synergies and Trade-Offs (FAO 2009)
Yes. Our diet and food choices have a significant impact on our carbon footprint. Food production is the main source of GHG emissions in the agriculture value chain driven by consumption demands and patterns. Therefore, increasing the efficiency of food production systems may not be enough to reduce GHG emissions from agriculture if we do not change some diet patterns, especially meat-based diets that include high emitting livestock. The weight of this dietary behavior shift lies in high-income countries whose citizens can afford alternative and varied protein sources. Animal-based foods are generally the most important contributors to resource use and dietary GHG emissions. Replacing meat and dairy products with plant-based foods can significantly reduce GHG emissions from the agriculture sector. Specific interventions include:
- Leveraging existing food and resource security policies to reduce meat production and imports and promote alternative proteins,
- Promoting public health policies that incentivize healthy diets and levels of protein intake, and
- Reducing future demand for meat products and decreasing per capita meat consumption through media and outreach campaigns.
Policy, Finance & Other Incentives
In the first round of nationally determined contributions (NDCs) (2015) to the UNFCCC, 128 countries included agriculture in an economy-wide GHG emissions target in their NDC. None of the largest agricultural emitters (e.g., India ) included sector-specific contributions from the agriculture sector in their NDCs, but most included agriculture in their economy-wide targets. Agricultural mitigation policies and measures of 59 countries' NDCs typically focused on cropland management, livestock management, and grazing land management.
Current emission reduction targets for agriculture may not be enough to meet the 2˚C or 1.5˚C goal. Meeting the Paris Agreement 2°C goal will require global mitigation of agricultural non-CO2 emissions of approximately 1 GtCO2e yr-1 by 2030. Meeting the goal of a 1 GtCO2e yr-1 reduction will require countries to be ambitious in selecting their mitigation targets for agriculture.
Learn more from this review of the second round of NDCs submitted in 2021.
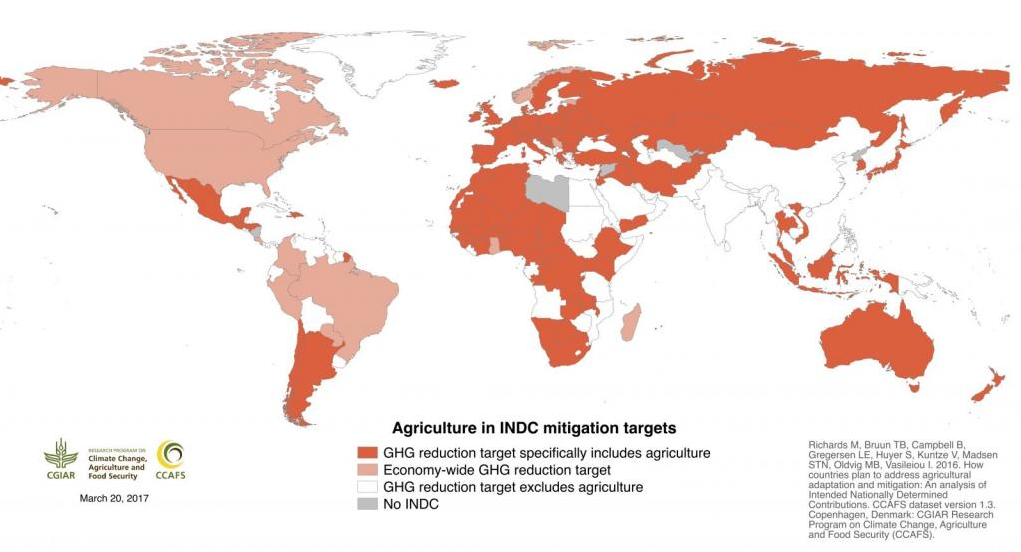 Source: Agriculture's prominence in the INDCs: data and maps (Richards M, et al. 2016)
There is a range of policy options currently available at the global, regional, and national levels. Under the UNFCCC (e.g., Nationally Determined Contributions), policies guide climate action in agriculture and allied sectors at the regional and national levels. These policies set the GHG mitigation targets and encourage implementing mitigation actions at the national and sub-national levels supported by technology, financing, and capacity building.
A range of domestic policies is designed to reduce GHG emissions from agriculture and enhance the role of agriculture in GHG mitigation in global and national policies and strategies. Many countries have their own domestic GHG mitigation policies independent of UNFCCC and other global policies and negotiations. They include performance standards, technology standards, incentivizing best-practice measures, subsidies, carbon tax, emission trading and public support for mitigation research.
There are several climate financing sources available for investment in the agriculture sector. These sources include multilateral funds under the UNFCCC framework, such as the Green Climate Fund (GCF), and the Global Environment Facility (GEF). Other available sources outside the UNFCCC framework are bilateral and multilateral funds and commercial and private finance.
Current funding sources include:
- Government budgets (public capital);
- Public financial intermediaries, such as bilateral aid agencies, climate funds, and multilateral, bilateral, and national development finance institutions,
- Private financial intermediaries, such as commercial financial institutions, private equity, venture capital, infrastructure funds, and institutional investors; and
- Private domestic and multinational companies, and project developers (private capital).