Jump to: Methods and sources of activity data | Methods and sources of emissions factors
Manure management produces both CH4 and N2O. In the IPCC methodology, manure management emissions include N2O from the storage and treatment of livestock dung and urine before it is applied to land or used for other purposes, and CH4 produced during the storage and treatment of manure, and from manure deposited on pasture.
Emissions from manure applied to cropland or grassland soils as an amendment are accounted for under N2O emissions from managed soils. Emissions associated with the burning of dung for fuel are reported as energy or waste emissions (depending on whether energy is recovered).
Estimating emissions from manure management
What data are required?
Tier 1
Estimating GHG emissions from animal manure requires two types of activity data:
- Animal population data by animal subcategory (the same subcategories should be used as for enteric fermentation)
- Total amount of volatile solids (VS) excreted by animal subcategory in each type of manure management system;
The approach and activity data required to estimate emissions differ slightly between CH4 and N2O.

- Emissions of CH4 = CH4 emissions from manure management, for a defined livestock population, Gg CH4 yr-1
- EFT= emission factor for the defined livestock population, kg CH4 head-1 yr-1 (IPCC, 2019; Table 10.14)
- NT = the number of head of livestock species/category T in the country
- VS(T, P)= annual average VS excretion per head of species/category T, for productivity system P, when applicable in kg VS animal-1 yr-1 (IPCC, 2019; Table 10.13a calculated by Equation 10.22a)
- AWMS(T, S, P) = fraction of total annual VS for each livestock species/category T that is managed in manure management system S in the country, for productivity system P, when applicable; dimensionless, default regionally specific AWMS fractions are found in IPCC, 2019; Tables 10A.6 through 10A.9)
- T = species/category of livestock
- S = manure management system
- P = high productivity system or low productivity system for use in advanced Tier 1a – omitted if using a simple Tier 1 approach
As with enteric fermentation, the only activity data required for the Tier 1 approach to estimating CH4 emissions from manure are animal population data by animal subcategory. IPCC Tier 1 emission factors for each region assume the most common manure management system in that region.
Using the Tier 1 method, default emission factors are based on the livestock species, manure management system, and productivity system; these factors represent the range in manure volatile solids content and manure management practices used in each region.
N2O emissions from manure (as with emissions from fertilizer) include both direct and indirect emissions. Estimating N2O emissions from manure requires animal population data and data about manure management systems.
Direct N2O emissions
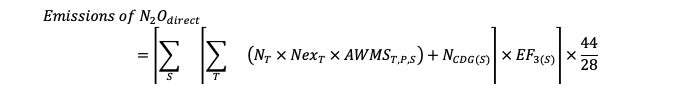
- Emissions of N2Odirect = direct N2O emissions from manure management, kgN2O yr-1
- NT = number of head of livestock species/category T
- NexT= annual average N excretion per head of species/category T, kg N animal-1 yr-1 (IPCC, 2019; Table 10.19)
- AWMST, S, P = fraction of total annual nitrogen excretion for each livestock species/category T that is managed in manure management system S in the country, dimensionless (this is often assumed to be identical to the fraction of manure by weight that is managed in manure management system S) (IPCC, 2019; Tables 10A.6 through 10A.9)
- EF3(S) = emission factor for direct N2O emissions from manure management system S, kg N2O-N/kg N in manure management system S (IPCC, 2019; Table 10.21)
- NCDG(S)= annual nitrogen input via co-digestate in the country, kg N yr-1, where the system (s) refers exclusively to anaerobic digestion (Volume 2, Chapter 2, Section 2.3.3.4; “Waste” Volume 5, Chapters 2 and 3, Sections 2.3.2 and 3.2.)
- P = productivity class, high or low, to be considered if using the Tier 1a approach
- S = manure management system
- T = species/category of livestock
- 44/28 = conversion of N2O-N emissions to N2O emissions
Manure management systems are categorized as:
- Pasture/range/paddock
- Daily spread
- Solid storage
- Dry lot
- Liquid/slurry
- Uncovered anaerobic lagoon
- Pit storage below animal confinements
- Anaerobic digester
- Burned for fuel
- Cattle and swine deep bedding
- Composting; in-vessel
- Composting; static pile
- Composting; passive windrow
- Poultry manure with litter
- Poultry manure without litter
- Aerobic treatment
Indirect N2O emissions from volatilization and runoff
Indirect N2O emissions are emissions from nitrogen lost from the field or farm via volatilization as NH3 and NOx or via leaching and runoff. Indirect manure N2O emissions from volatilization can be calculated using Tier 1 equations and emission factors.
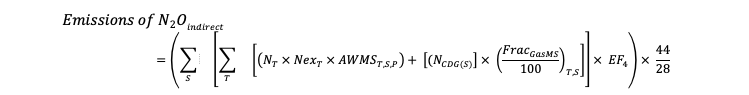
- Emissions of N2Oindirect = indirect N2O emissions due to volatilization of N from manure management, kg N2O yr-1
- NT = number of head of livestock species/category T
- NexT= annual average N excretion per head of species/category T, kg N animal-1 yr-1 (IPCC, 2019; Table 10.19)
- AWMST,S,P = fraction of total annual nitrogen excretion for each livestock species/category T that is managed in manure management system S in the country, dimensionless (this is often assumed to be identical to the fraction of manure by weight that is managed in a manure management system (S)) (IPCC, 2019; Tables 10A.6 through 10A.9)
- FracGasMS = percent of managed manure nitrogen for livestock category T that volatilizes as NH3 and NOx in the manure management system (S), % (IPCC, 2019; Table 10.22)
- NCDG(S)= annual nitrogen input via co-digestate in the country, kg N yr-1, where the system (S) refers exclusively to anaerobic digestion (Volume 2, Chapter 2, Section 2.3.3.4; “Waste” Volume 5, Chapters 2 and 3, Sections 2.3.2 and 3.2.)
- EF4 = emission factor for N2O emissions from atmospheric deposition of nitrogen on soils and water surfaces, kg N2O-N (kg NH3-N + NOx-N volatilized)-1; default value is 0.01 kg N2O-N (kg NH3-N + NOx-N volatilized)-1 (IPCC, 2019; Chapter 11; Table 11.3).
Indirect manure N2O emissions from manure N2O emissions from leaching and runoff can be calculated using Tier 1 equations and emission factors.
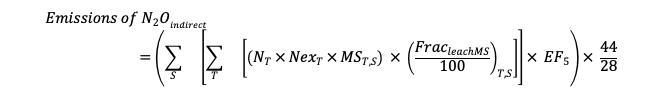
- Emissions of N2Oindirect = indirect N2O emissions due to leaching and runoff of N from manure management, kg N2O yr-1
- NT = number of head of livestock species/category (T)
- NexT= annual average N excretion per head of species/category T, kg N animal-1 yr-1 (IPCC, 2019; Table 10.19)
- AWMST,S,P = fraction of total annual nitrogen excretion for each livestock species/category T that is managed in manure management system S in the country, dimensionless (this is often assumed to be identical to the fraction of manure by weight that is managed in manure management system S) (IPCC, 2019; Tables 10A.6 through 10A.9)
- FracleachMS = percent of managed manure nitrogen losses for livestock category T due to runoff and leaching during solid and liquid storage of manure (typical range 1-20%) (IPCC, 2019; Table 10.22)
- EF5 = emission factor for N2O emissions from leaching and runoff, kg N2O-N (kg N leaching/runoff)-1; default value is 0.0075 kg N2O-N (kg N leaching/runoff)-1(IPCC, 2019; Chapter 11; Table 11.3).
- 44/28 = conversion of (N2O-N) emissions to N2O emissions
Tier 2
Tier 2 estimates of CH4 from manure management require data on:
- Manure characteristics: Includes the amount of volatile solids (VS) produced in the manure and the maximum amount of methane able to be produced from that manure (B0).
- Animal waste management system characteristics (AWMS): Includes the types of systems used to manage manure and a system-specific methane conversion factor (MCF) that reflects the portion of Bo that is achieved.
To implement the Tier 2 method, one or more variables to determine the CH4 emission factor from manure management for each country’s livestock type and manure management conditions must be improved:

- VST = daily volatile solid excreted for livestock category T, kg dry matter animal-1 day-1 (IPCC, 2019; Table 10.13a calculated by Equation 10.22a)
- 365 = basis for calculating annual VS production, days yr-1
- Bo(T) = maximum methane producing capacity for manure produced by livestock category T, m3 CH4 kg-1 of VS excreted (IPCC, 2019; Table 10.16)
- 67 = conversion factor of m3 CH4 to kilograms CH4
- MCFS,k = methane conversion factors for each manure management system S by climate region k, % (IPCC, 2019; Table 10.17; Annex 10.A.4)
- AWMST,S,k = fraction of livestock category T’s manure handled using manure management system S in climate region k (IPCC, 2019; Tables 10A.6 through 10A.9)
Volatile solids (VS) are the organic material in livestock manure, equal to the fraction of diet not consumed that is excreted as fecal material. VS excretion rates (VST) depend on feed intake and feed characteristics such as digestibility. Average VS excretion rates can be obtained from published literature for the country or area in question or estimated from average feed intake levels (also required for Tier 2 estimates of enteric fermentation emissions).
The Tier 2 method for N2O from manure management uses the same equation as Tier 1 but includes country- or region-specific data for some or all of the variables, rather than Tier 1 default values (IPCC, 2019; Chapter 10 – pages 10.81-10.89).
Methods and sources of activity data
Livestock population data
Estimates of emissions from manure should be calculated using the same livestock population data as for enteric fermentation.
Manure management data
- A fraction of manure (by weight) handled in each type of manure management system, for each animal population category, is often collected through national agricultural surveys or expert consultations.
- Moeletsi ME, Tongwane MI. 2015. 2004 methane and nitrous oxide emissions from manure management in South Africa. Animals.
- Provides an example of the use of expert data to estimate emissions from manure using Tier 1 and Tier 2 methods)
- Manure Knowledge Kiosk
- Managing manure to reduce greenhouse gas emissions
- MRV Platform for Agriculture: Measuring, verifying and reporting GHG emissions from agriculture
Methods and sources of emission factors
- Owen JJ, Silver WL. 2015. Greenhouse gas emissions from dairy manure management: a review of field-based studies. Global Change Biology.
- This study synthesized a global dataset on GHG emissions from manure management on dairies, compare the data with modeled values, and identify the greatest mitigation opportunities.
- Pelster DE, et al. 2016. Methane and Nitrous Oxide Emissions from Cattle Excreta on an East African Grassland. Journal of Environmental Quality.
- Gonzales-Avalos E, Ruiz-Suarez LG. 2007. Methane conversion factors from cattle manure in México. Atmosfera.
- See case studies of the methods used to compile Tier 2 livestock GHG inventories at the AgMRV Platform for Agriculture.